Lab: More Graphics
Preparation
a. Create a folder and put Zelle’s graphics.py file in it.
b. Open up an extra tab to the Online Graphics Reference. You can also find this on the Resources page.
c. Open a Terminal and navigate to your lab directory.
Exercise 1
Let’s play around with detecting key presses from the user. Create a new file called move_circle.py and place the following code into it.
"""Simple demo of moving an object with key presses

Author: Titus Klinge and YOUR NAMES HERE
"""

from graphics import *
import math

def main():

    win = GraphWin("Moving a Circle", 500, 500)
    win.setCoords(0, 0, 1, 1)

    circ = Circle(Point(0.25, 0.25), 0.1)
    circ.setFill("red")
    circ.draw(win)

    while win.isOpen():

        # Checks if the user just pressed an arrow key
        # and if so, moves the circle in that direction
        key = win.checkKey()
        if key == 'Up':
            circ.move(0, 0.01)
        elif key == 'Down':
            circ.move(0, -0.01)
        elif key == 'Right':
            circ.move(0.01, 0)
        elif key == 'Left':
            circ.move(-0.01, 0)

        # slows down the loop to only 60 times per second
        update(60)

if __name__ == "__main__":
    main()
a. Run the code and use the arrow keys on your keyboard to watch the circle move.
b. What if we want to change the color of the circle via a key press? Modify the code so that if you press the space bar key the color of the circle changes to blue. Note that the checkKey method returns the string "space" if the space bar is pressed.
c. Now let’s try to change the color based on a mouse click! First we need to use the checkMouse() method to check if the user has clicked recently. Add the following line at the top of the while loop:
mouse = win.checkMouse()
Now let’s cause the circle to turn green if the mouse was clicked. Add the following code right before the update(60) but after the if-elif code block:
if mouse != None:
    circ.setFill("green")
d. Run the code again and verify that clicking anywhere in the window causes the circle to turn to green.
e. Right now if the user clicks anywhere on the screen it will turn the circle green. What if we want to only want it to turn green if the click on the circle? To do this we will need to make sure where they clicked is inside the bounds of the circle. Thus, we need to be able to calculate the distance between two points. Read the documentation of the following function and add it above the main function in your program.
def distance(p1, p2):
    """Calculates the distance between two points

    Parameters:
        p1: a Point object
        p2: a Point object

    Returns:
        A float that is the distance between points p1 and p2
    """
    xdiff = p1.getX() - p2.getX()
    ydiff = p1.getY() - p2.getY()
    return math.sqrt(xdiff**2 + ydiff**2)
f. Using the distance function, change the code above so that the circle only turns green if the user clicks inside the circle. (You will need to compare the point the user clicked to the current location of the circle and see if it is within its radius. If you don’t remember how to check where the center of the circle is or its radius, review the documentation for Circle.)
Exercise 2
In this exercise we are going to play around with the color_rgb function. To help with this, I am providing you the following function:
def show_color(r, g, b):
    """Displays a window showcasing the given rgb color

    Parameters:
      r: an integer
      g: an integer
      b: an integer

    Returns:
      Nothing; called for the side effect

    Preconditions:
      - r, g, and b are integers between 0 and 255, inclusive

    Postconditions:
      - A GraphWin window is created that shows the given color
    """
    win = GraphWin("{}/{}/{}".format(r,g,b))
    win.setBackground(color_rgb(r,g,b))
a. Create a file colors.py and add the above function to it. Don’t forget to add the import statement from graphics import * so that it has access to the GraphWin class!
b. Open up a REPL and import the function.
>>> from colors import show_color
c. Try visualizing various RGB colors by calling the show_color function.
>>> show_color(255, 128, 0)
>>> show_color(0, 128, 128)
>>> show_color(128, 43, 97)
d. Experiment with other RGB values to see what colors you can produce.
Exercise 3
In this exercise we will experiment with images. To help, I have provided you with the following function to display an image once it has been created.
def show_image(img):
    """Displays the image in a window

    Parameters:
      img: an Image object

    Returns:
        Nothing; called for the side effect

    Postconditions:
      - A GraphWin window is constructed that is the same dimensions
        as the image.
      - The image is displayed and centered in the window.
    """
    win = GraphWin("Image Viewer", img.getWidth(), img.getHeight())

    # Below, we set the coordinates so that img is centered
    # in the window so that when drawn it takes up the full
    # space of the window
    anchor = img.getAnchor()
    x, y = anchor.getX(), anchor.getY()
    win.setCoords(x-1, y-1, x+1, y+1)

    img.draw(win)
a. Create a file called images.py and place the above code inside it. Don’t forget to add the import statement from graphics import * at the top of the file!
b. Download this extremely cute cat picture and save it in your lab directory.
c. Open up the REPL and import the show_image function:
>>> from images import show_image
d. Now create and show the cat image:
>>> img = Image(Point(0,0), "cat.gif")
>>> show_image(img)
e. We can also write functions that manipulate images to create cool effects. Consider the following example.
def apply_gradient(img):
    """Applies a gradient effect to the given image

    Parameters:
      img: an Image object

    Returns:
        Nothing; called for the side effect

    Postconditions:
      - Every pixel in img is made darker. The closer the pixel
        is to the left-side of the image, the darker the pixel becomes.
    """
    # iterates over all the pixels
    for y in range(img.getHeight()):
        for x in range(img.getWidth()):
            pixel = img.getPixel(x, y)

            # mult is how close we are to the left-side of the image
            # if x = 0, then mult = 0
            # if x = width, then mult = 1
            #
            # We then multiply mult by each of the pixel color values
            # to calculate the new color
            mult = x / img.getWidth()
            r = int(pixel[0] * mult)
            g = int(pixel[1] * mult)
            b = int(pixel[2] * mult)

            # Updates the pixel color
            img.setPixel(x, y, color_rgb(r,g,b))
Copy the above function into your images.py file you previously created and import it into the REPL:
>>> from images import *
f. Try applying it to the cat image.
>>> cat = Image(Point(0,0), "cat.gif")
>>> apply_gradient(cat)
>>> show_image(cat)
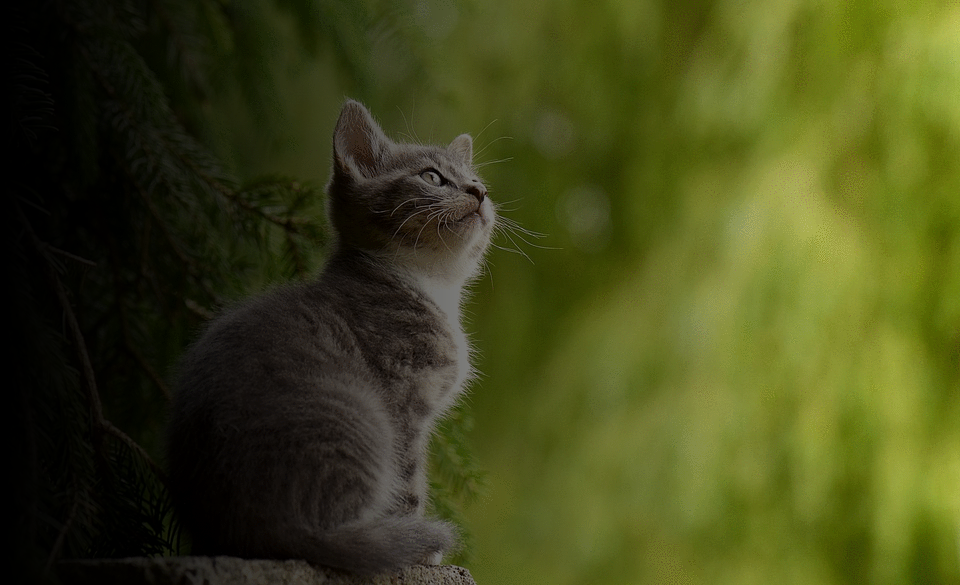
You should see the following image:

g. We can even save images back to the disk after we have modified them. Try saving the modified image using the save method and then try viewing it with the default Mac OSX picture viewer.
>>> cat.save("cat_gradient.gif")
Exercise 4
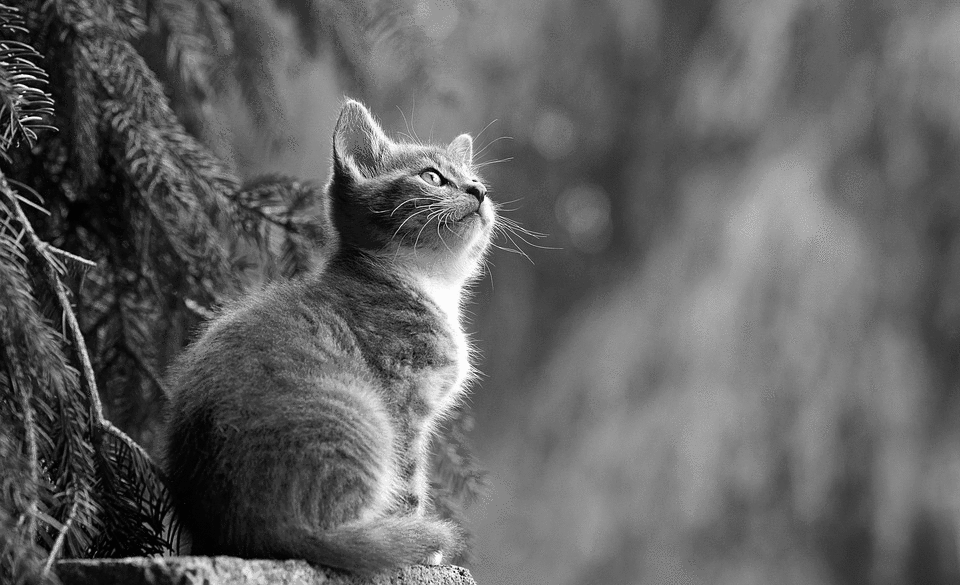
What other cool effects can we implement in Python and apply to images? One common one is creating a grayscale effect. Using the apply_gradient function from the previous exercise as a guide, implement a function apply_grayscale(img) that takes an Image object as a parameter and modifies it so that every pixel is grayscale. All gray colors have the same values for R, G, and B, and a common technique for turning a single pixel gray is by taking the average of its RGB components. For example, if your pixel is red, i.e. pixel = [255, 0, 0], the grayscale version of this pixel is [85,85,85] because (255+0+0)//3 is 85.
When you show the modified image, you should see the following.
