[Optional Extension] Assignment 6 - Parsing and Visualizing Data
Due: Wednesday, March 11, 2020, at 5pm
You may work alone or with a partner, but you must type up the code yourself. You may also discuss the assignment at a high level with other students. You should list any student with whom you discussed the assignment, and the manner of discussion (high-level, partner, etc.) in a readme.txt file that you include with your submission.
You should submit your assignment as a .zip file on Moodle.
You will work in one file for this assignment. Additionally, you will need your weatherPlotter.py program from Assignment 5 and the data file weatherData.csv.
- Skeleton code. You should save the code file as
weatherPlotterExtension.pyin a folder withweatherPlotter.pyandweatherData.csv.
Parts of this assignment:
- Problem 1: Parsing the weather data into a per-month dictionary
- Problem 2: Visualizing weather data by month
Note on style:
The following style guidelines are expected moving forward, and will typically constitute 5-10 points of each assignment (out of 100 points).
- Variable names should be clear and easy to understand, should not start with a capital letter, and should only be a single letter when appropriate (usually for
i,j, andkas indices, potentially forxandyas coordinates, and maybepas a point,cfor a circle,rfor a rectangle, etc.). - It’s good to use empty lines to break code into logical chunks.
- Comments should be used for anything complex, and typically for chunks of 3-5 lines of code, but not every line.
- Don’t leave extra print statements in the code, even if you left them commented out.
- Make sure not to have code that computes the right answer by doing extra work (e.g., leaving a computation in a for loop when it could have occurred after the for loop, only once).
Note: The example triangle-drawing program on page 108 of the textbook demonstrates a great use of empty lines and comments, and has very clear variable names. It is a good model to follow for style.
Problem 1: Parsing the weather data into a per-month dictionary
For this problem, you should implement the buildDictionaryByMonth function. It should take in the list of dates (each is a string of the form “mm/dd/yyyy”, where “mm” is a one- or two-character string representing the month), and a list of temperatures. The function should output a dictionary that maps each month (stored as an int) to the corresponding list of temperatures for that month.
def buildDictionaryByMonth(dates, temps):
    """
    Returns a dictionary mapping month number (January is 1, etc.)
    to a list of temperatures for that month.
    """
    return None # TODO
Once you’ve implemented this function, you can add this line to main (make sure you remove it before submitting):
print(monthToMinTempsMap[3])You should get the following output:
[0, 3, -18, -16, -16, 0, -5, -5, 21, 22, 11, 11, 26, 35, 25, 19, 19, 23, 24, 30, 28, 27, 23, 36, 28, 26, 27, 32, 29, 29, 18]
Problem 2: Visualizing weather data by month
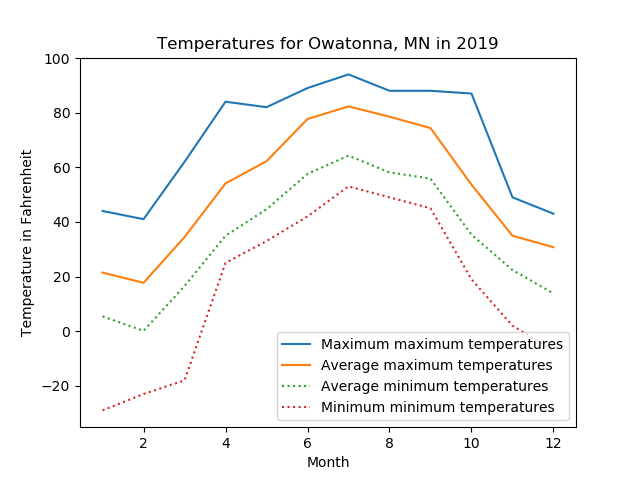
Given the per-month dictionaries for both minimum and maximum temperatures, you should plot the following monthly data:
- the maximum max-temp for each month
- the average max-temp for each month
- the average min-temp for each month
- the minimum min-temp for each month
To do this, implement the following function:
def plotMonthlyData(minTempsDict, maxTempsDict):
    """
    Plots both the minimum, average, and maximum of each of the
    minimum temperatures maximum temperatures for each month.
    """
    pass # TODO
Your final plot should look something like the one below:

For this problem (and no others), you are encouraged to explore online for help using Matplotlib. This can include the Matplotlib documentation and stack overflow. Just make sure to cite any website (with the full URL) you visit in your readme.txt. Note that you should still only be collaborating closely (e.g., viewing code) with your partner, if you choose to have one.
What you should submit
You should submit a single .zip file on Moodle. It should contain the following files:
readme.txt(collaboration statement listing collaborators and form of collaboration, and any websites visited for problem 2)weatherPlotterExtension.py(both problems)