Lab: debugging C with VS Code & mantis
In this lab, you'll practice using VS Code's C debugger.
The images in this lab are from macOS, because my current laptop is a Mac. The Windows and Linux versions of VS Code look similar to this, but not identical, so you should adapt accordingly.
What's a debugger?
A debugger is a tool designed to help you debug your programs (duh). Debuggers tend to have dozens of sophisticated features, but the heart of the matter for most programmers is this: a debugger allows you to run your program one line at a time, enabling you to examine your variables along the way. If you can watch your variables evolve one slow line of code at a time, you can usually track down your errors.
Phase 1: setting breakpoints and looking at variables
- Launch VS Code and connect to mantis
- Install C/C++ Extension Pack. Select the View→Extensions menu, search for the C/C++ Extension Pack from Microsoft, and install it.
- Get a program to debug. Copy the debug_this.c sample to your working directory on mantis. You can do this by File→New Text File followed by copying and pasting. Or you can use your mantis terminal and a variant of the wget command described in the Starting C assignment to grab debug_this.c. (It's good to be able to do both.)
- Read it, run it, see it has a bug. (Yes, I know it's a simple bug to diagnose and correct, but let's leave it alone for the moment.)
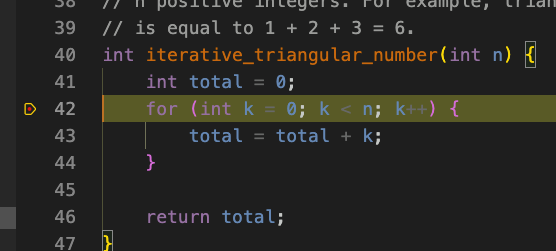
Set a breakpoint. Once you have a copy of debug_this.c open in VS Code, scroll down to the function iterative_triangular_number. At the line with the for-loop, hover your mouse to the left of the line number. You will see a ghost of a red dot. Click to make that red dot solid.
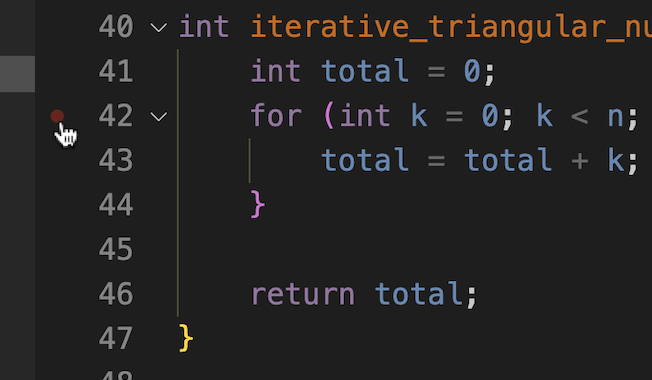
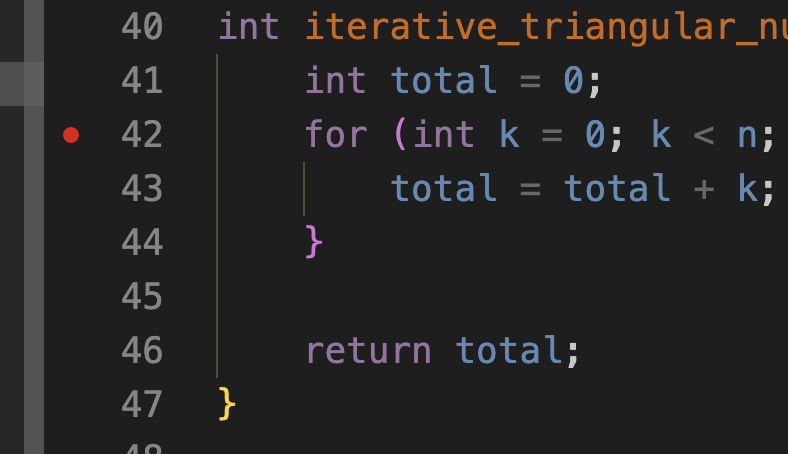
When you run the program in debugging mode, the program will stop just before executing the line of code at your breakpoint.
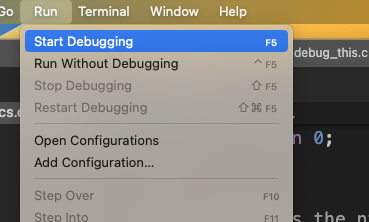
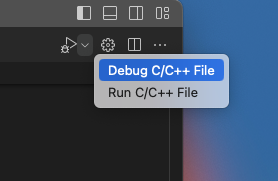
Start debugging. You can do this either from the Run menu or from the play-button-with-a-bug in the upper right corner of VS Code.
Your program will stop when it first gets to your breakpoint.
Look around for a minute. In the code, the line at your breakpoint is highlighted. This line has not yet executed.
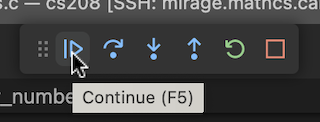
There's a menu at the top with: a continue button for letting your program continue from where you left off; a stop button for, well, stopping the program; and a few other buttons. Hover over them to see what they're called.
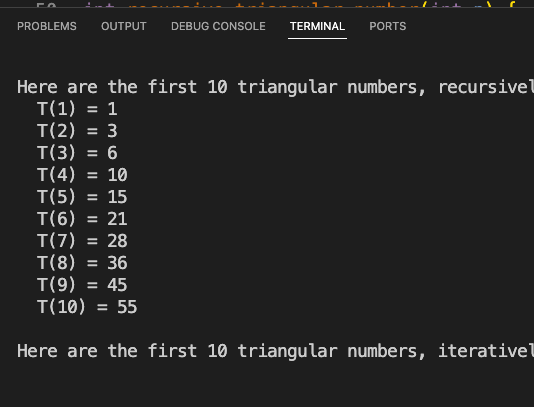
There's the terminal/console display at the bottom, showing that the program has already produced some output, but is stopped halfway.
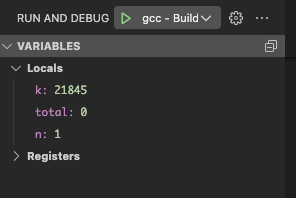
Most important of all, way up in the upper left corner, there is the Variables panel, showing you the current values of the variables k and total, as well as the parameter n. Note that k hasn't been initialized yet, so it may have some random value.
And finally, down in the bottom left, there's the Call Stack. What do you think this is?
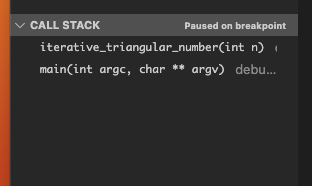
Step through your code. When the program stopped at your breakpoint, you were in the middle of iterative_triangular_number(1) (how can you tell?). You can now step through your program one line at a time.
- Click the Step Over button on the debugging toolbar
- Look at the Variables panel. Did the variable values change the way you expected them to?
- Repeat until the program returns to main. Go slowly. Pay attention to what changes after each click of the Step Over button.
- Keep going until you're at the line in main iterative_triangular_number(2) is about to be called. Now, instead of clicking Step Over, click the Step Into button.
- Keep doing this as long as you want (or until you see what the bug is).
(I can't really emphasize enough how powerful it is to simply step through your code slowly to see whether it's doing what you expect it to do. Get in the habit of doing this when you have a bug, for sure. But also do it when you think your code is OK—I have found a lot of subtle bugs this way.)
- Hit the Stop button. You can get the File Explorer back via the View→Explorer menu.
What about command-line arguments?
Get a copy of character_counter.c into your mantis working directory. Note that this program requires a command-line argument. How can we provide that argument to the debugger?
- Open character_counter.c in VS Code
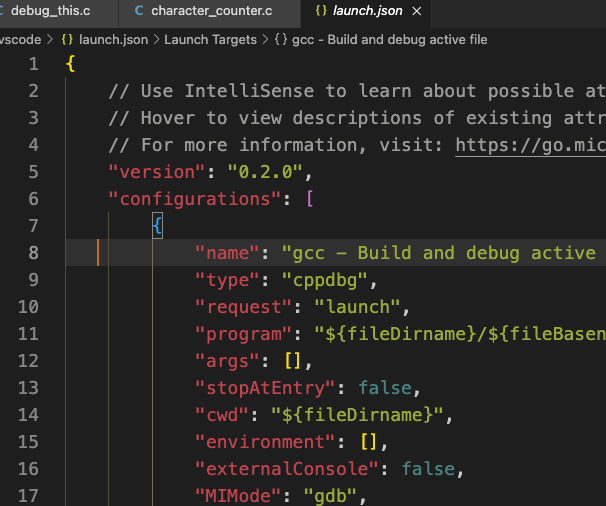
Open the "configuration" file for your debugging session.

Here's what my configuration file looks like. Yours will likely be similar.
Create a small text file for character_counter.c to work on. Here's mine.

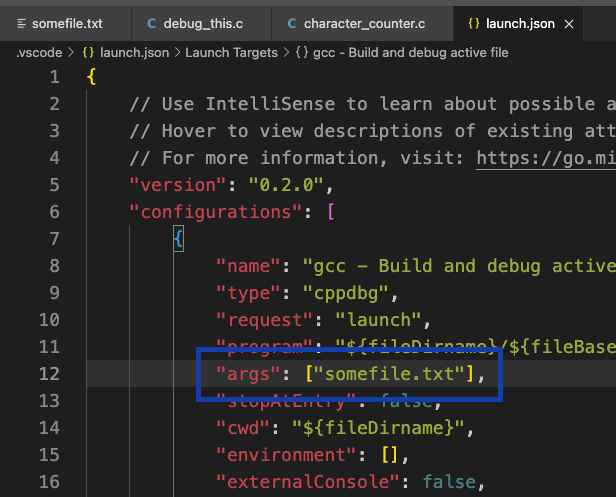
Edit (and save) the configuration file to enter your command-line argument.
- Now open character_counter.c and run it in the debugger. Does it work?
A few more things to try
In debug_this.c:
- Comment out everything in main except the return statement
- Add a call to recursive_triangular_number(10) and a print statement to print out its result
- Put a breakpoint somewhere in recursive_triangular_number
- Run the debugger
- When you hit the breakpoint, take a look at the Variables panel; is it showing what you expect? Also, look at the Call Stack panel; is it showing what you expect?
- Click the Continue button. You should land at your breakpoint again. How have the Variables and Call Stack panels changed? Repeat this a couple times.
- Now, you should have quite a few function calls showing in the Call Stack. Click on each of them, and when you do, look at the Variables panel. What changes as you click on each function call? Explore, experiment, whatever.
- How would you explain the Call Stack to a CS 111 student?
- What's the difference between the Step Over and Step Into buttons? Test this. Also, what happens if you try to Step Into a C library function like printf?
- What if your program requires more command-line arguments? What syntax do you use in the launch.json/configuration file?
- Declare an array in main or some other function and break somewhere in that function. What does the array look like in the Variables panel?
- Put a breakpoint in character_counter.c's main just before get_character_count gets called. When your program hits that breakpoint, take a look at the input_file_name variable in the Variables panel. Make sure your Variables panel is wide enough that you can see both the numerical/address value of input_file_name as well as the string that it points to.
That's it!
There's lots more to learn about using a debugger, but this should give you a good start. Keep practicing!