You have tried out a couple HTTP-based APIs, and learned a little bit how to use an API from within a Python program. You have also seen a few basic elements of API implementation with Flask. Now, you're going to design a simple database and a simple API to give access to that database, and then implement the API using Flask and PostgreSQL.
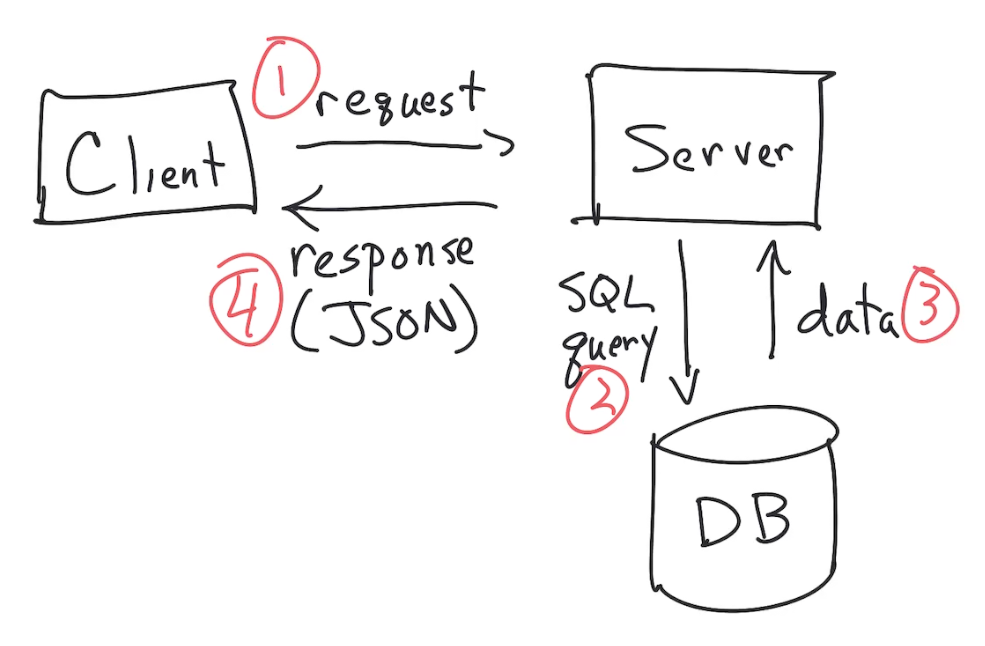
This is the data-flow sequence we'll be trying to implement. Client makes a request to Server, which makes a query of Database, which responds to Server, which responds to Client.
The data
We're going to use US COVID-19 data from the COVID Tracking Project, but instead of using their API directly, you're going to download their all-states data and load it into a database of your own to provide the data source for your API.
The database schema
Your database will consist of two tables. First, there's the states table:
Each row of this table will represent one state, like (13, 'Minnesota', 'MN') or (53, 'Guam', 'GU'). Note that I'm making up 13 and 53 for this example. Those IDs will be whatever you deem suitable.
Each row of the second table, covid19_days, will store COVID-19 statistics for one state for one day.
So, for example, here's Minnesota for 8 Oct 2020: ('2020-10-08', 13, 6, 1271, 14147, 98)
The API
Here are the API endpoints you'll implement:
Your tasks
- Create a new postgres database called "covid19" on your working computer. (The Unix command "createdb covid19" ought to do the job.)
- Launch psql using your covid19 database and create the two tables (states and covid19_days) described above.
- Download a copy of COVID Tracking Project's all-states data. You'll use this file's contents to populate the tables in your database. Don't worry that the data will be out of date 24 hours later. This is just a practice exercise, and pretty much any amount of data will be sufficient.
- Fill your two tables with appropriate data from the all-states data file.
- In your repository, create a covid19 directory. In that directory, make a copy of flask_sample.py called covid19_api.py. Inside covid19_api.py, delete all the extraneous code (e.g. the movies/actors data).
- In covid19_api.py, create one stub for each endpoint of the API described above.
The stubs should return whatever type of object the API specifies. So, for example, if
the API says an endpoint should return a JSON list, then your stub's return statement would
just return the JSON representation of an empty list, like this:
return json.dumps([])
- Implement the API endpoints. Note that to do so, your API endpoint functions will need to send SQL queries to your covid19 postgres database.
- When you're done, export your postgres database into your covid19 folder:
cd covid19 pg_dump --no-owner --no-privileges covid19 > covid19.sqland git add/commit/pull/push to include it in your repository.
Suggestions
- Populating your database tables can be
trickier than it looks, but it's an important skill to develop. A few suggestions:
- I recommend doing this by converting the data into two separate CSV files, one for each table, and then using psql's \copy directive to load the CSV files into the tables.
- I would start by using a spreadsheet program (e.g. Excel, Numbers, or Google Sheets) to clear out the clutter. Load all-states-history.csv into the spreadsheet, and delete all the columns that aren't included in our covid19_days table, and then export the resulting spreadsheet as a new CSV file, say covid.
- The trickiest bit will be replacing the state abbreviations in the state column of all-states-history.csv with state ID numbers in the state_id column of covid19_days.csv. Need ideas about how to do this? Let me know.
- NOTE: there are more than 50 states in this dataset.
- Think ahead of time about how to break your work into small steps. Talk this through with your partner. Choose steps that are short and easy to tell when you're done. If you look at your list of steps and see a step that says "load the data into the database", think again—how can you break that big step into little steps?
- Focusing on code quality from the beginning will help you complete this assignment more quickly than if you don't. Pick your names carefully. Decompose your code into single-purpose functions. If there's a task that needs to be performed in more than one API endpoint, write a function to perform that task (i.e. try to create reusable functions). etc.
- Start early. There are enough steps in this project that you should plan to work on it over multiple days. That gives you enough time to step away, take a walk, read a book, sleep at night(!), etc. when you get stuck, and then come back fresh. I can't tell you how many times I have broken through a coding impasse by going out and walking my dog.
- Pay attention to your personal development process. Keep a list of questions and lessons learned. Notice what worked for you and what didn't. If you feel uneasy about a chunk of code (e.g. "this function's parameters are kind of awkward"), take that feeling seriously! A big part of creating good code architecture is using your aesthetic judgment, so if some code feels wrong to you, that's important.
- Finding this hard? That's because it's hard! Persistence and a willingness to ask questions will get you there.
- Have fun! (You're writing an API server. Cool!)